

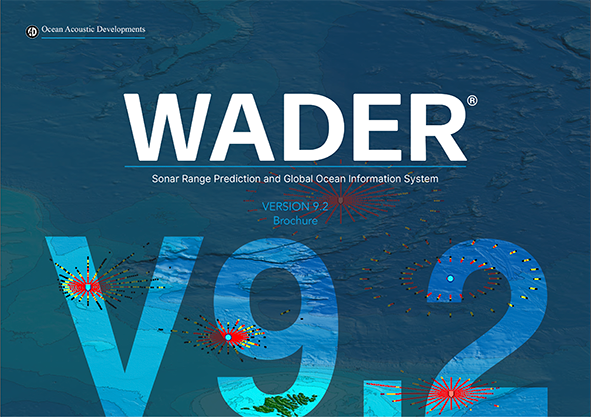
WADER
![]()
WADER
![]()
What is WADER?
WADER is a comprehensive sonar range prediction and Global Ocean Information System which combines environmental data together with user-supplied parameters to generate propagation loss data (PL) and calculate sonar probability of detection.
Designed for users of all abilities, data is generated in real time. Analysis of the data can provide information such as best evasion depth, likely target depths and optimum sonar position.
WADER is supplied with Sonar Parameters for Unclassified Training Systems (SPUTS), global bathymetry, environmental and sediment databases together with a wide variety of oceanographic reference chart types so that WADER has everything it requires to perform sonar range predictions out of the box. Users are able to upload their own sensor parameters, high-resolution bathymetry data and customisable chart overlays.
Why choose WADER for your Sonar Range Prediction capability?

Flexible solution
WADER can be installed on a Command Management System (CMS), laptop and even tablets

Sensor agnostic
Suitable for most operational sonars in any ocean, with support for hull mounted, monostatic, bistatic and multistatic active and passive sensors

Fully range dependent
WADER takes into account changes in water column, bathymetry and sediment data along each track

Independently verified
The Propagation Loss models have been independently verified by UK MoD scientists

COTS solution
All essential datasets are provided with the system on delivery. User data can be incorporated if available

Years of operation
The first operational version of WADER was deployed in 1991 and has been updated every year since

What is WADER?
WADER is a comprehensive sonar range prediction and Global Ocean Information System which combines environmental data together with user-supplied parameters to generate propagation loss data (PL) and calculate sonar probability of detection.
Designed for users of all abilities, data is generated in real time. Analysis of the data can provide information such as best evasion depth, likely target depths and optimum sonar position.
WADER is supplied with Sonar Parameters for Unclassified Training Systems (SPUTS), global bathymetry, environmental and sediment databases together with a wide variety of oceanographic reference chart types so that WADER has everything it requires to perform sonar range predictions out of the box. Users are able to upload their own sensor parameters, high-resolution bathymetry data and customisable chart overlays.
Why choose WADER for your Sonar Range Prediction capability?
|
|
|
||||
|---|---|---|---|---|---|---|
|
|
|
||||
|
WADER can be installed on a Command Management System (CMS), laptop and even a tablet |
Suitable for most operational sonars in any ocean, with support for hull mounted, monostatic, bistatic and multistatic active and passive sensors |
WADER takes into account changes in water column, bathymetry and sediment data along each track |
|
|
 |
|---|---|---|
Independently verified |
COTS solution |
Years of operation |
|
The Propagation Loss models have been independently verified by UK MoD scientists |
All essential datasets are provided with the system on delivery. User data can be incorporated if available |
The first operational version of WADER was deployed in 1991 and has been updated every year since |
What is WADER?
WADER is a comprehensive sonar range prediction and Global Ocean Information System which combines environmental data together with user-supplied parameters to generate propagation loss data (PL) and calculate sonar probability of detection.
Designed for users of all abilities, data is generated in real time. Analysis of the data can provide information such as best evasion depth, likely target depths and optimum sonar position.
WADER is supplied with Sonar Parameters for Unclassified Training Systems (SPUTS), global bathymetry, environmental and sediment databases, a wide variety of oceanographic reference chart types so that WADER has everything it requires to perform sonar range predictions out of the box. Users are able to upload their own sensor parameters, high-resolution bathymetry data and customisable chart overlays.
Why choose WADER for your Sonar Range Prediction capability?
Flexible solution
WADER can be installed on a Command Management System (CMS), laptop and even a tablet
Sensor agnostic
Suitable for most operational sonars in any ocean, with support for hull mounted, mono-static, bi-static and multi-static active and passive sensors
Fully range dependent
WADER accounts for changes in water column, bathymetry and sediment data along each track
Independently verified
The Propagation Loss models have been independently verified by UK MoD scientists
Comprehensive COTS solution
All essential datasets are provided with the system on delivery. User data can be incorporated if available
Years of operation
The first operational version of WADER was deployed in 1991 and has been updated every year since
Main Screen
- Sediment data charts
- Ambient noise & weather data (with 3rd party product access)
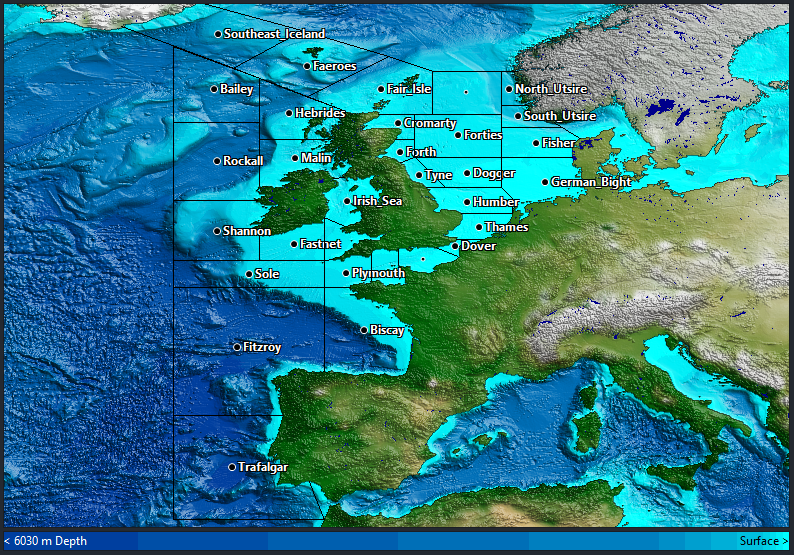
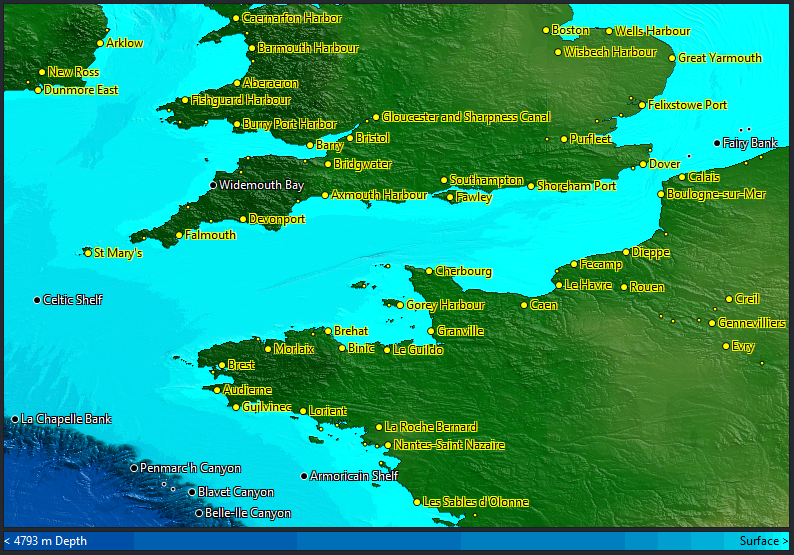
- Global port locations and ocean place names
- User defined area boundaries


2D Radial Sonar Range Prediction
Distance Measuring Tool
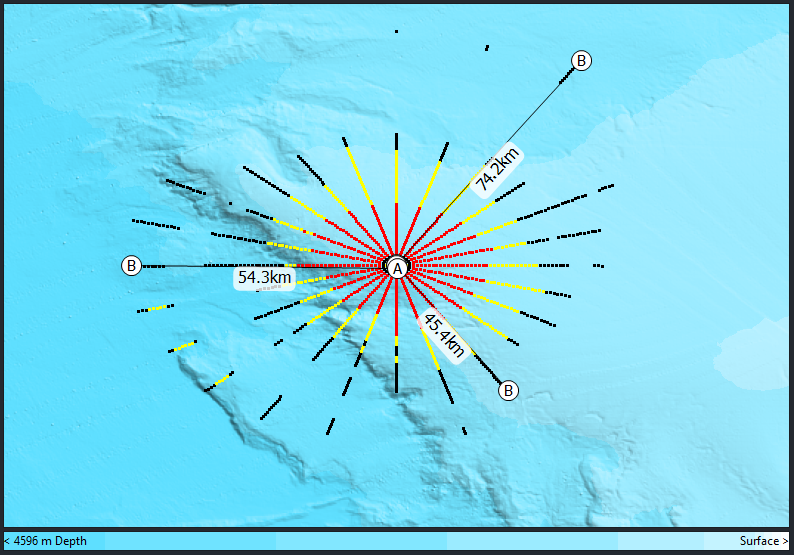
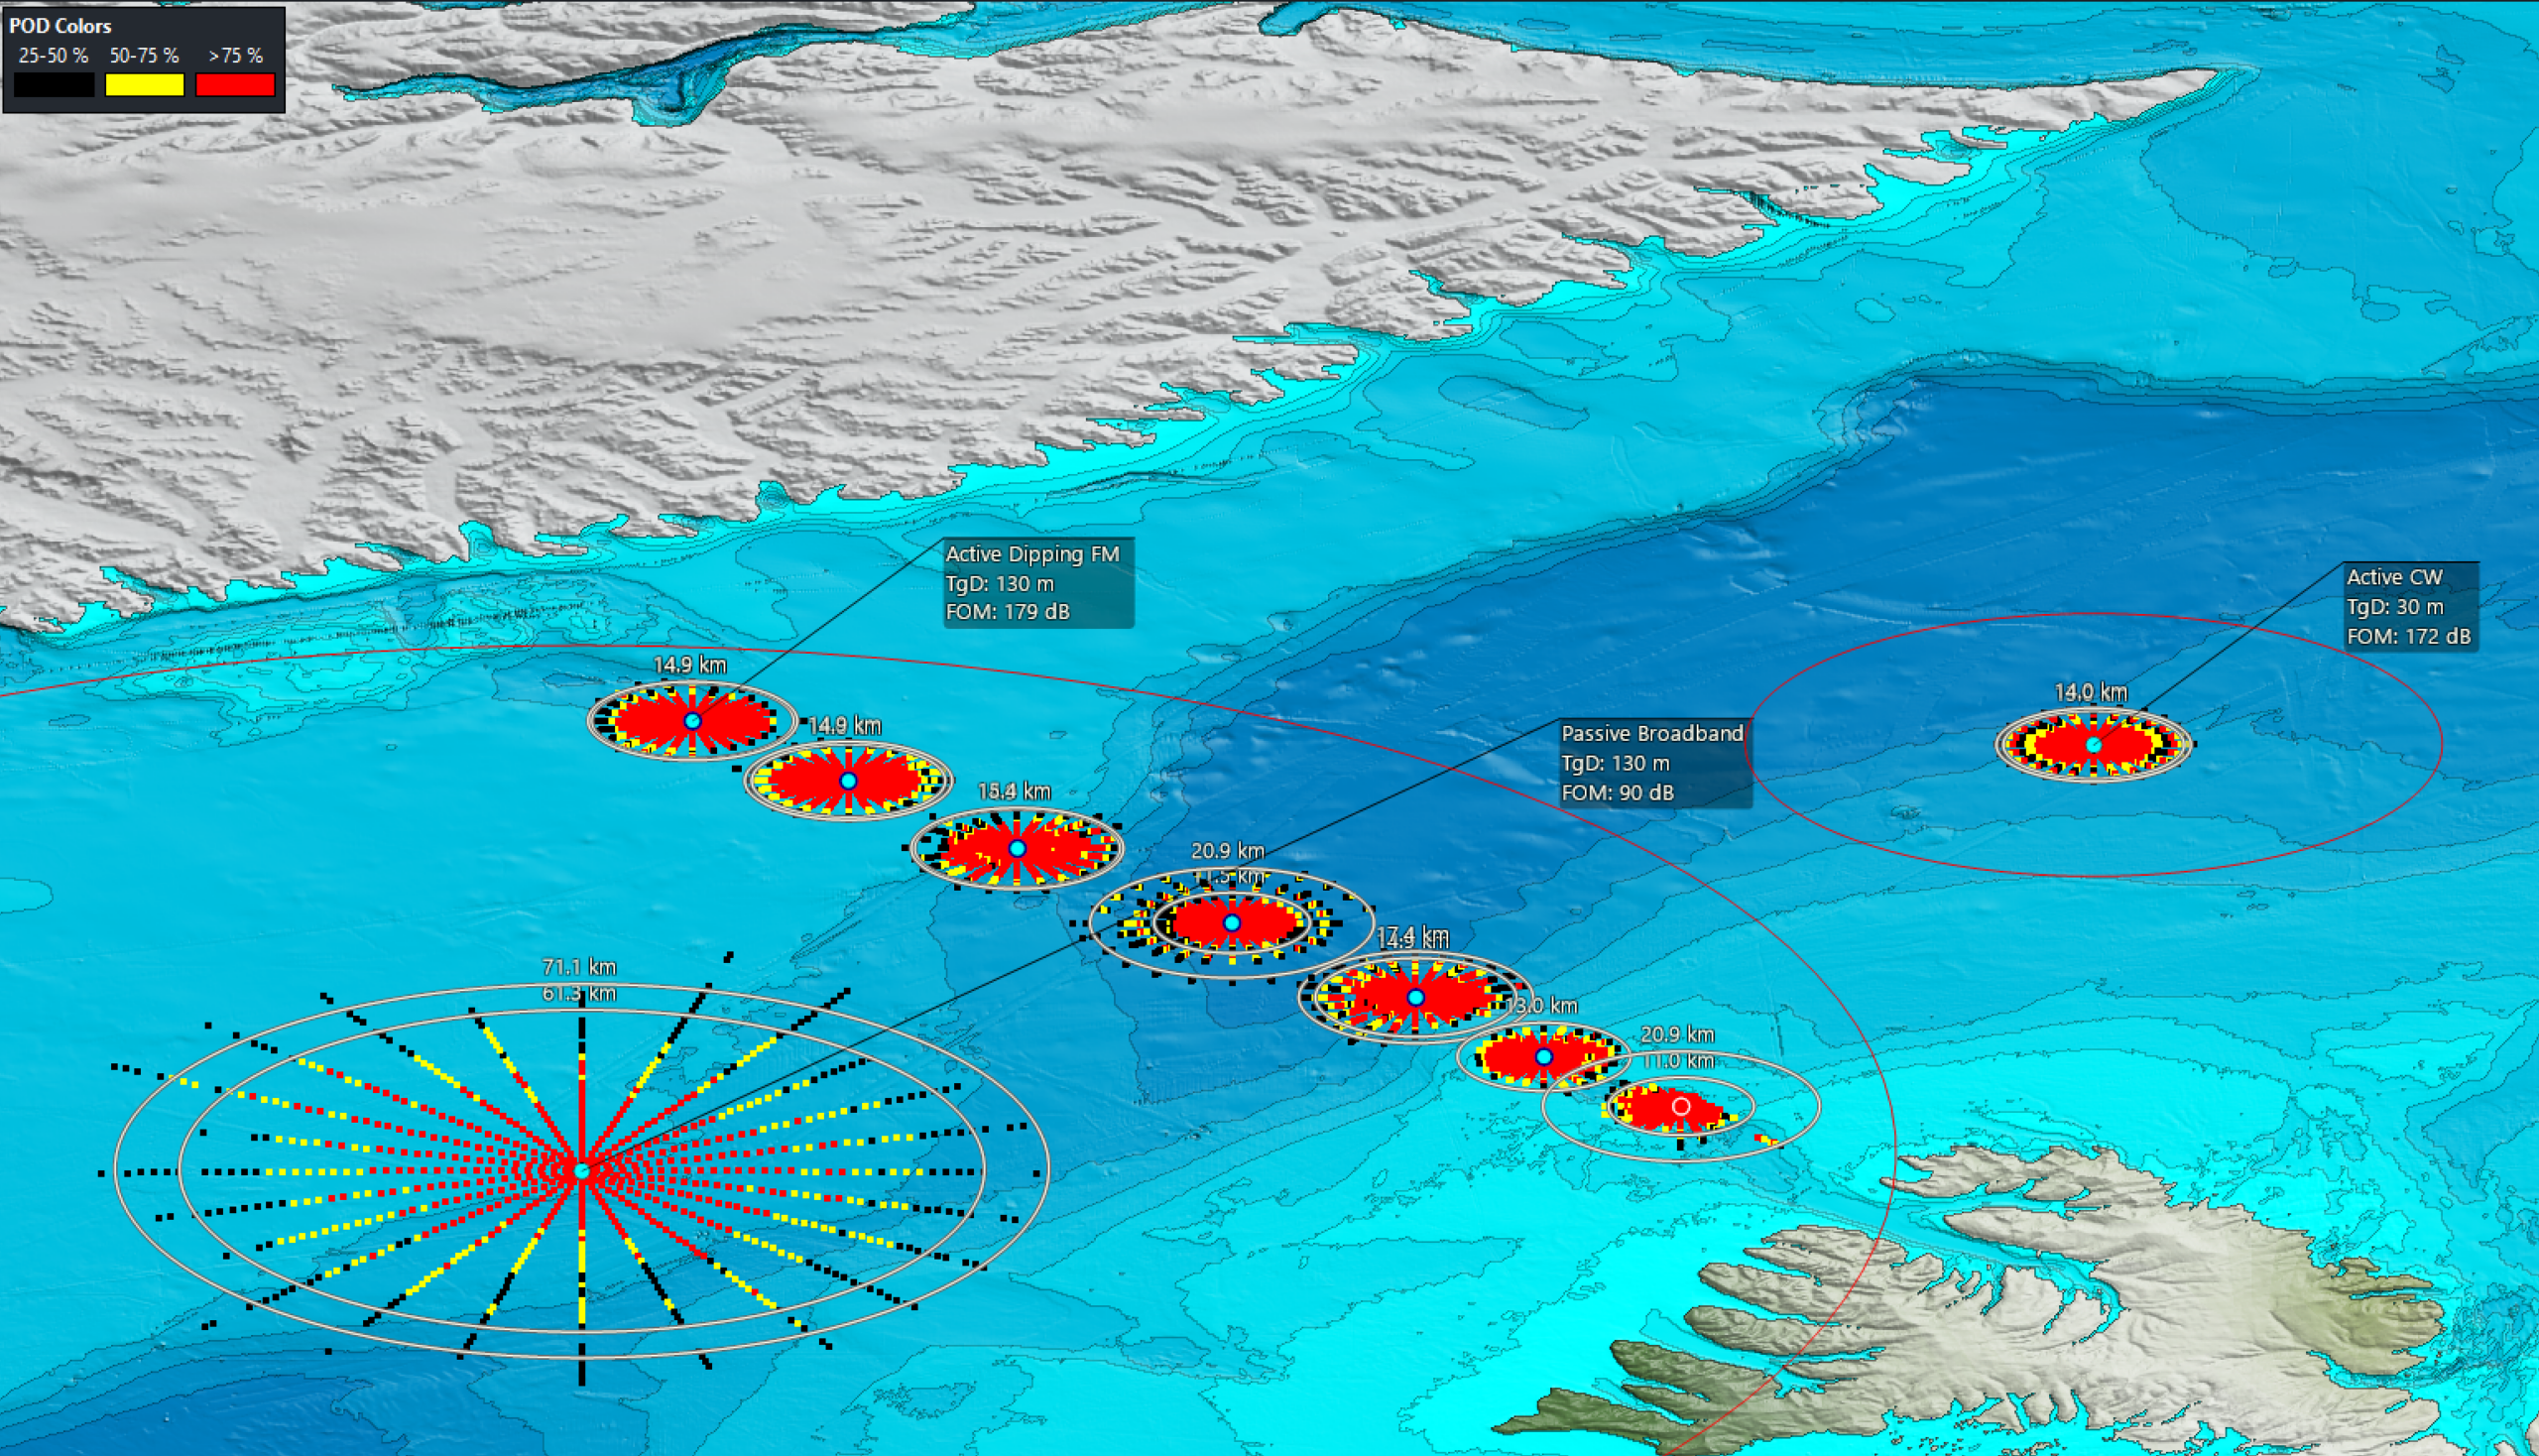
WADER provides both flat plan and vertical slice propagation loss displays. The former are displayed on the Main Screen using colour coded ‘blobby radials’ which are plotted at 15 degree (or greater) intervals.
Each set of radials can be configured independently in terms of sonar type, frequency, depth and Figure of Merit (FOM).
This feature allows users to overlay distance markers on their chart, thus enabling the measurement of non detection zones and other features.
The distance markers can be toggled on and off.
Click on the images below to view some other features on the Main Screen.
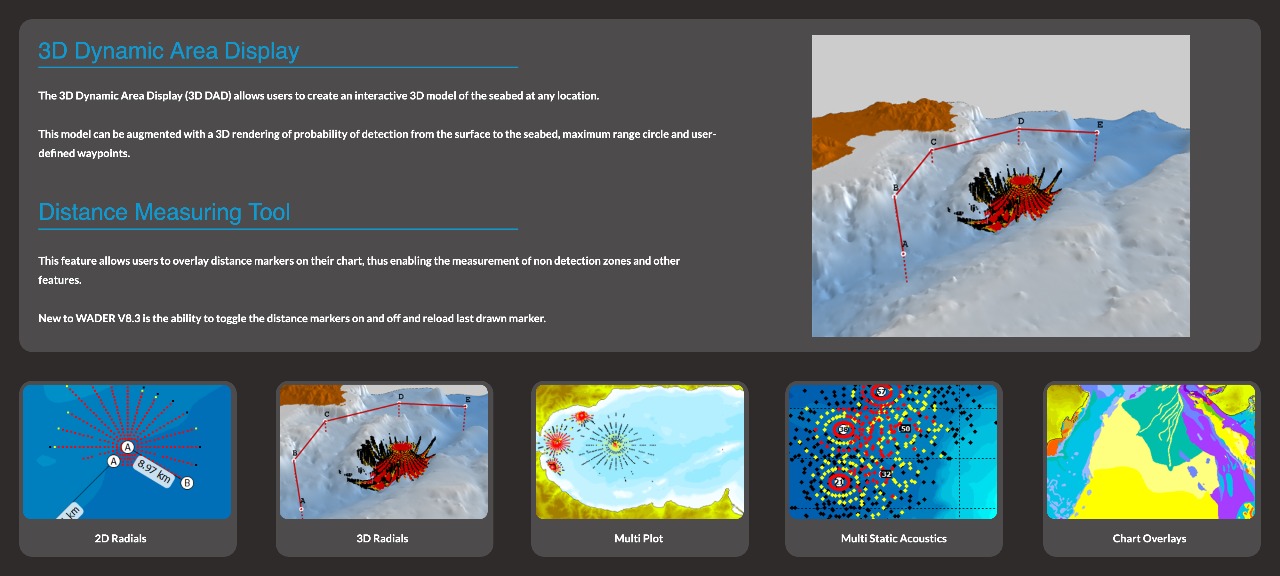
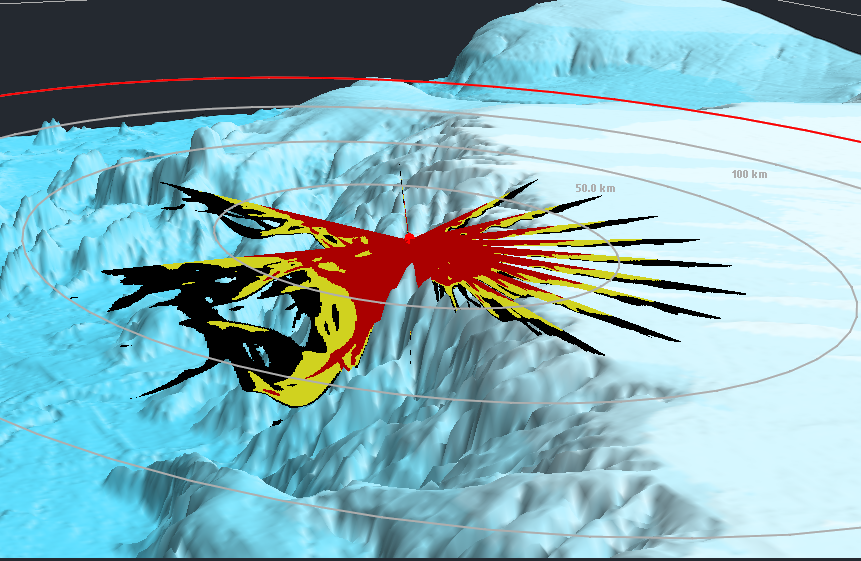
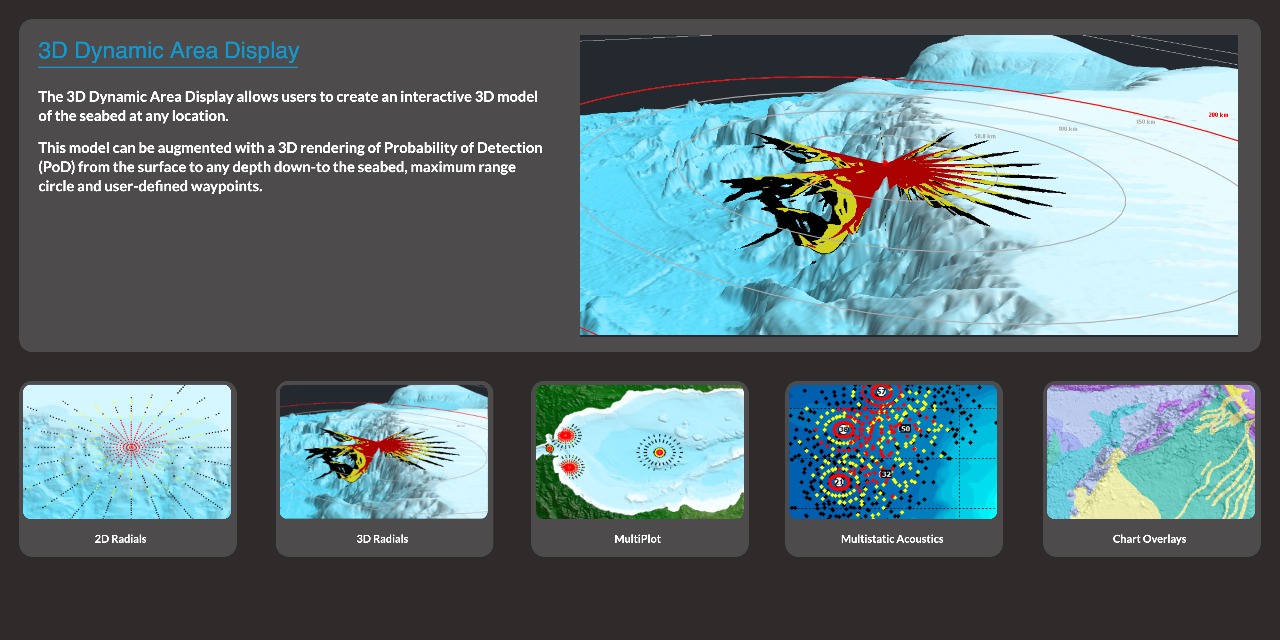
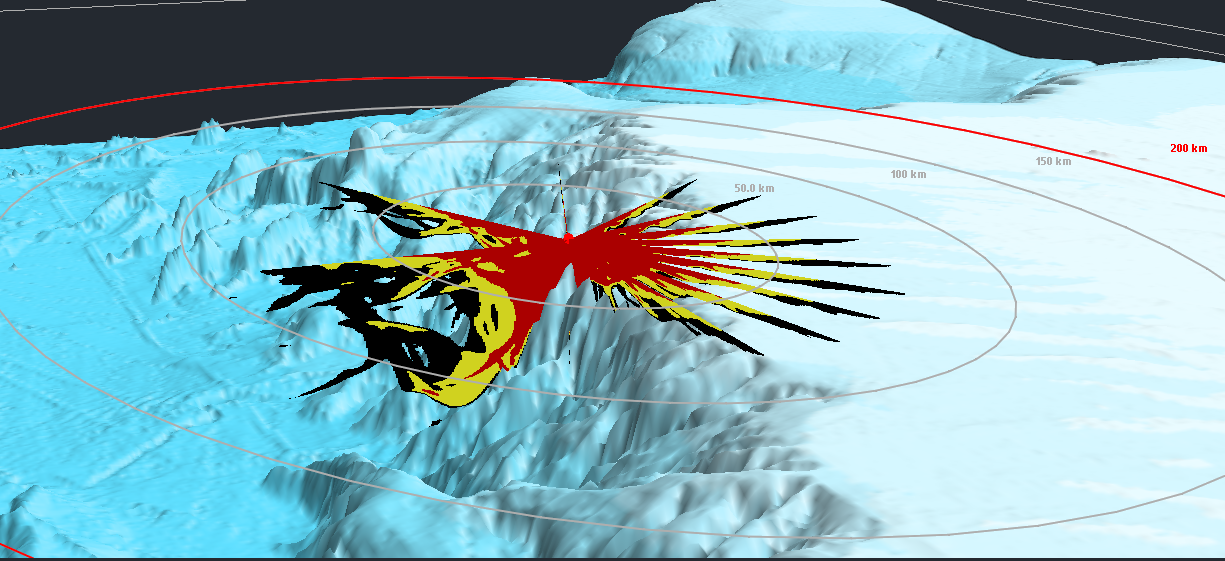
3D Dynamic Area Display
The 3D Dynamic Area Display allows users to create an interactive 3D model of the seabed at any location.
This model can be augmented with 3D renderings of Probability of Detection (PoD), user-defined waypoints , markers and areas.

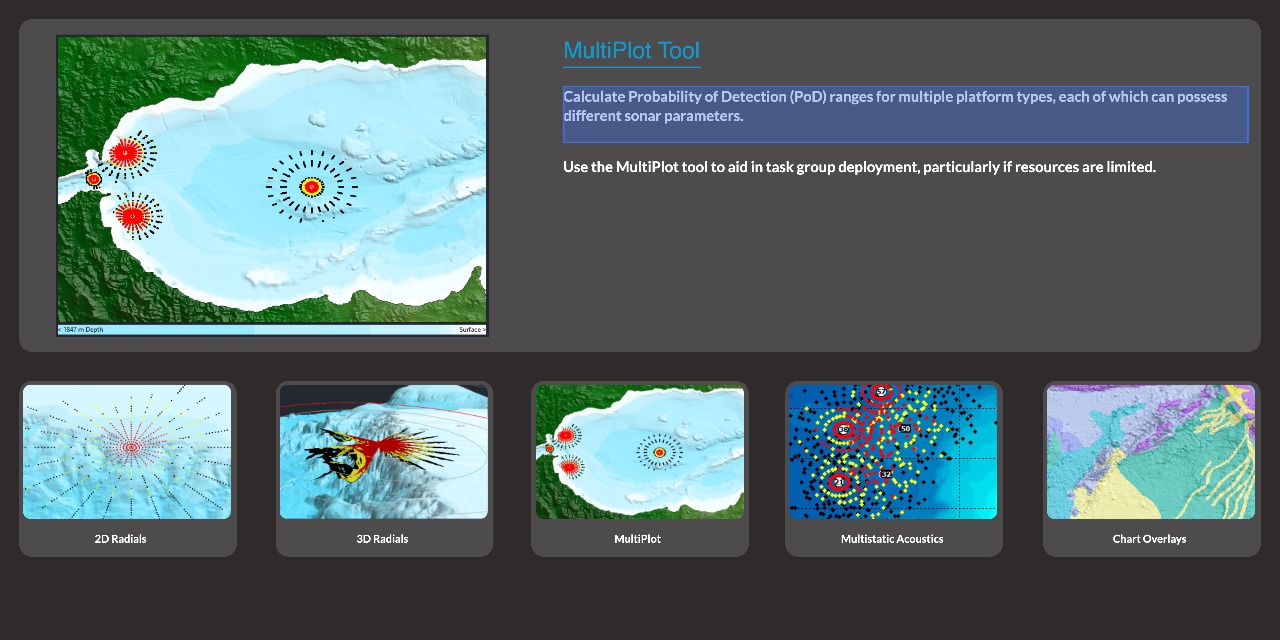
MultiPlot
Calculate Probability of Detection (PoD) ranges for multiple platform types, each of which can use different sonar parameters.

Multistatic Acoustics
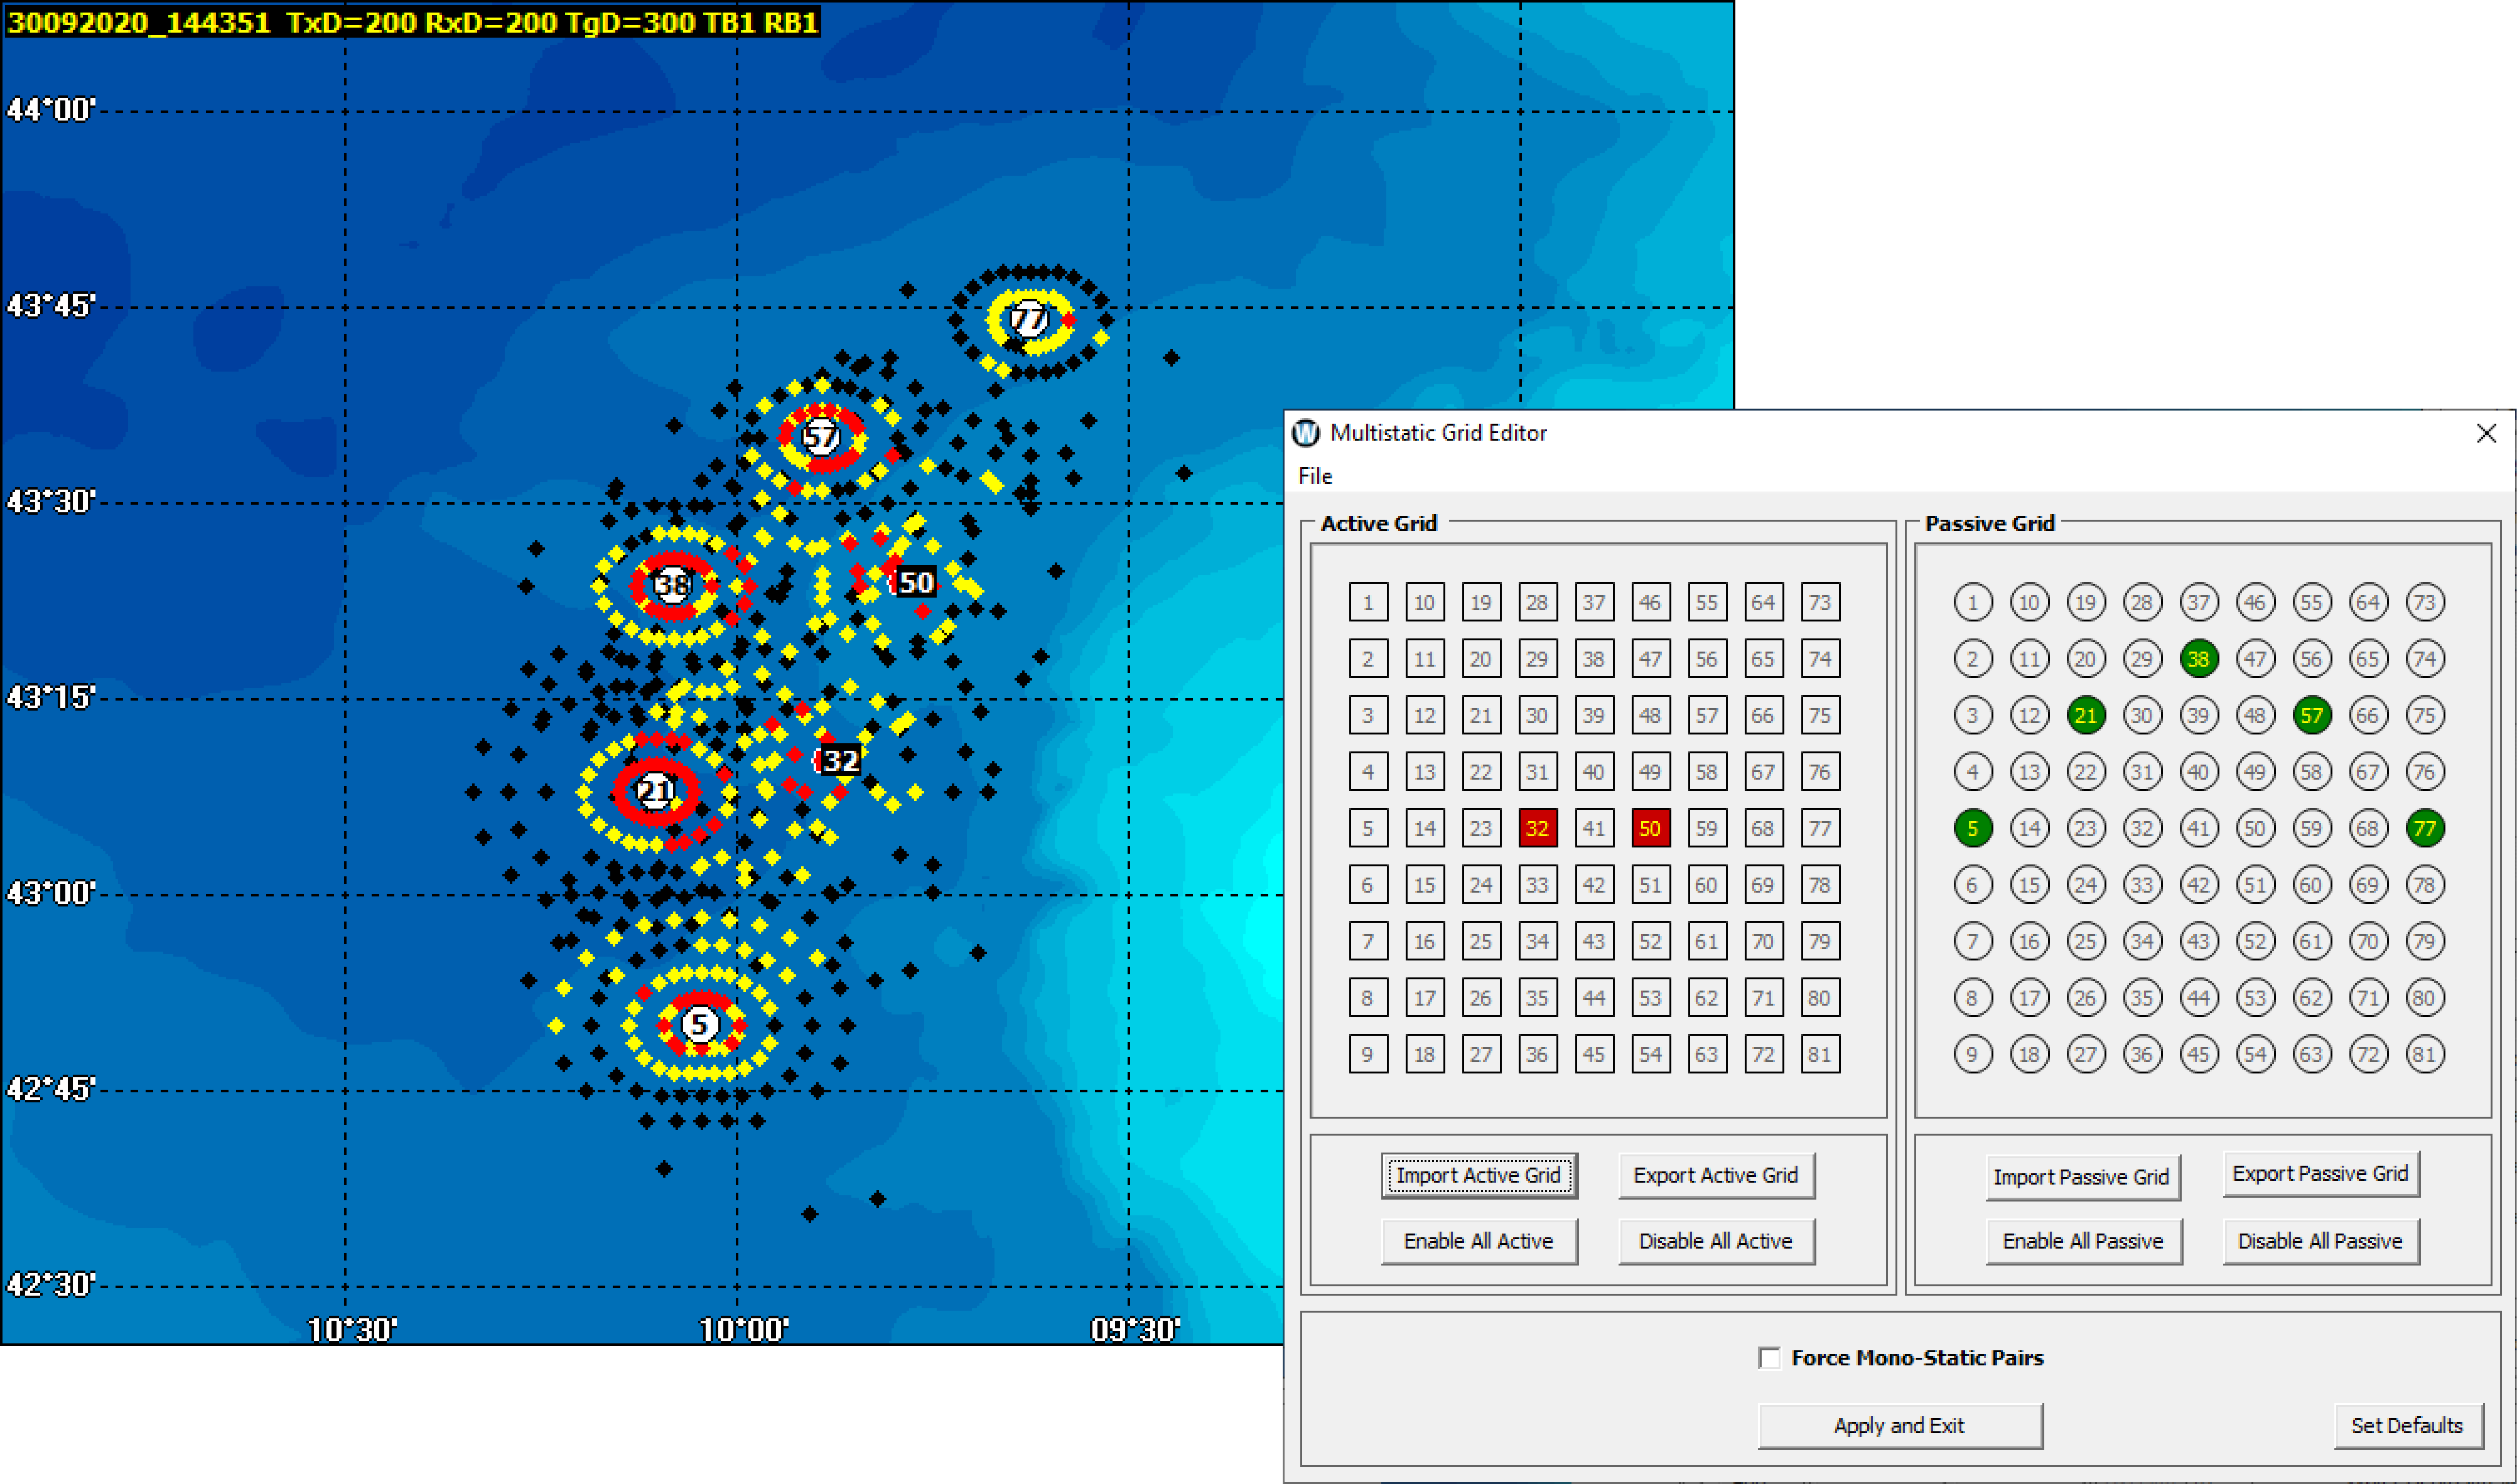
Multistatic Grid Editor
WADER includes a number of pre-defined tranducer patterns which can be augmented with user defined patterns.
The Multistatic Grid Editor has been updated to make the selection of different transducer patterns easier - this significantly improves the selection experience for tablet users.
The MSA is capable of predicting thousands of different transmitter/receiver position combinations via a 9x9 user defined grid pattern - up to 81 transmitters and 81 receivers can be activated.
The angle of offset and spacing between the transducers can easily be adapted using the controls.

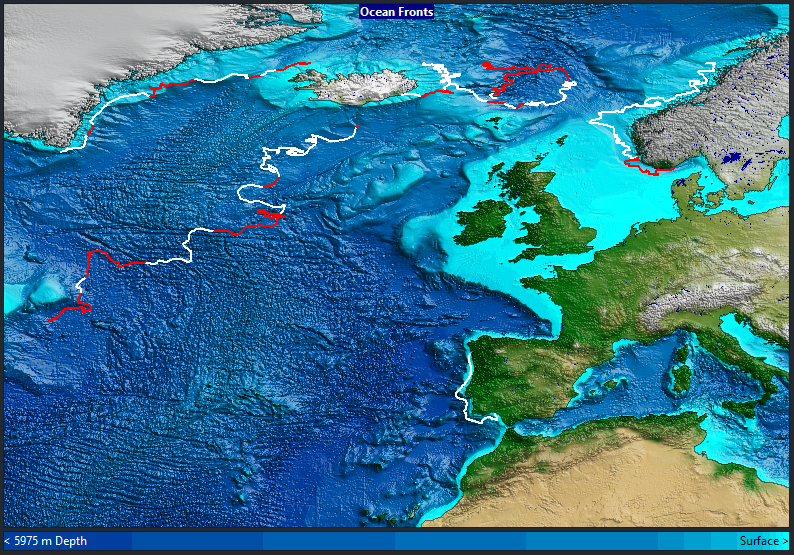
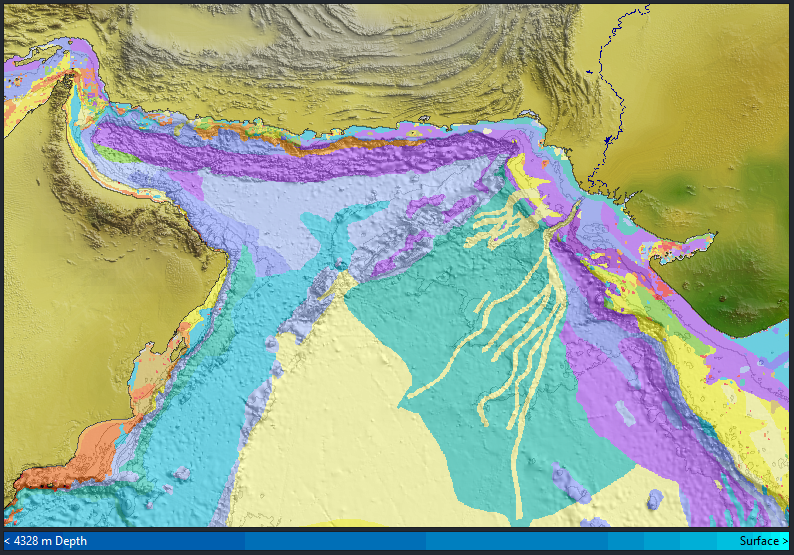
Chart Overlays
WADER allows the user to overlay many different elements on any chart. Below are just a few examples.
2D Radial Sonar Range Prediction
Distance Measuring Tool
WADER provides both flat plan and vertical slice propagation loss displays. The former are displayed on the Main Screen using colour coded ‘blobby radials’ which are plotted at 15 degree (or greater) intervals.
Each set of radials can be configured independently in terms of sonar type, frequency, depth and Figure of Merit (FOM).
This feature allows users to overlay distance markers on their chart, thus enabling the measurement of non detection zones and other features.
The distance markers can be toggled on and off.
Click on the images below to view other features on the Main Screen.
3D Dynamic Area Display
The 3D Dynamic Area Display allows users to create an interactive 3D model of the seabed at any location.
This model can be augmented with 3D renderings of Probability of Detection (PoD), user-defined waypoints , markers and areas.
MultiPlot
Calculate Probability of Detection (PoD) ranges for multiple platform types, each of which can use different sonar parameters.
Multistatic Acoustics
Multistatic Grid Editor
WADER includes a number of predefined transducer patterns which can be augmented with user defined patterns.
The Multistatic Grid Editor has been updated to make the selection of different transducer patterns easier - this significantly improves the selection experience for tablet users.
The MSA is capable of predicting thousands of different transmitter/receiver position combinations via a 9x9 user defined grid pattern - up to 81 transmitters and 81 receivers can be activated.
The angle of offset and spacing between the transducers can easily be adapted using the controls.
Chart Overlays
WADER allows the user to overlay many different elements on any chart. Below are just a few examples.
Main Screen
- Sediment data charts
- Ambient noise & weather data (with 3rd party product access)
- Global port locations and ocean place names
- User defined area boundaries
2D Radial Sonar Range Prediction
Distance Measuring Tool
WADER provides both flat plan and vertical slice propagation loss displays. The former are displayed on the Main Screen using colour coded ‘blobby radials’ which are plotted at 15 degree (or greater) intervals.
Each set of radials can be configured independently in terms of sonar type, frequency, depth and Figure of Merit (FOM).
This feature allows users to overlay distance markers on their chart, thus enabling the measurement of non detection zones and other features.
The distance markers can be toggled on and off.
Click on the images below to view some other features on the Main Screen.
3D Dynamic Area Display
The 3D Dynamic Area Display allows users to create an interactive 3D model of the seabed at any location.
This model can be augmented with 3D renderings of Probability of Detection (PoD), user-defined waypoints , markers and areas.
MultiPlot
Calculate Probability of Detection (PoD) ranges for multiple platform types, each of which can use different sonar parameters.
Multistatic Acoustics
Multistatic Grid Editor
WADER includes a number of pre-defined tranducer patterns which can be augmented with user defined patterns.
The Multistatic Grid Editor has been updated to make the selection of different transducer patterns easier - this significantly improves the selection experience for tablet users.
The MSA is capable of predicting thousands of different transmitter/receiver position combinations via a 9x9 user defined grid pattern - up to 81 transmitters and 81 receivers can be activated.
The angle of offset and spacing between the transducers can easily be adapted using the controls.
Chart Overlays
WADER allows the user to overlay many different elements on any chart. Below are just a few examples.
Main Screen
- Sediment data charts
- Ambient noise & weather data (with 3rd party product access)
- Global port locations and ocean place names
- User defined area boundaries

Environment Editor
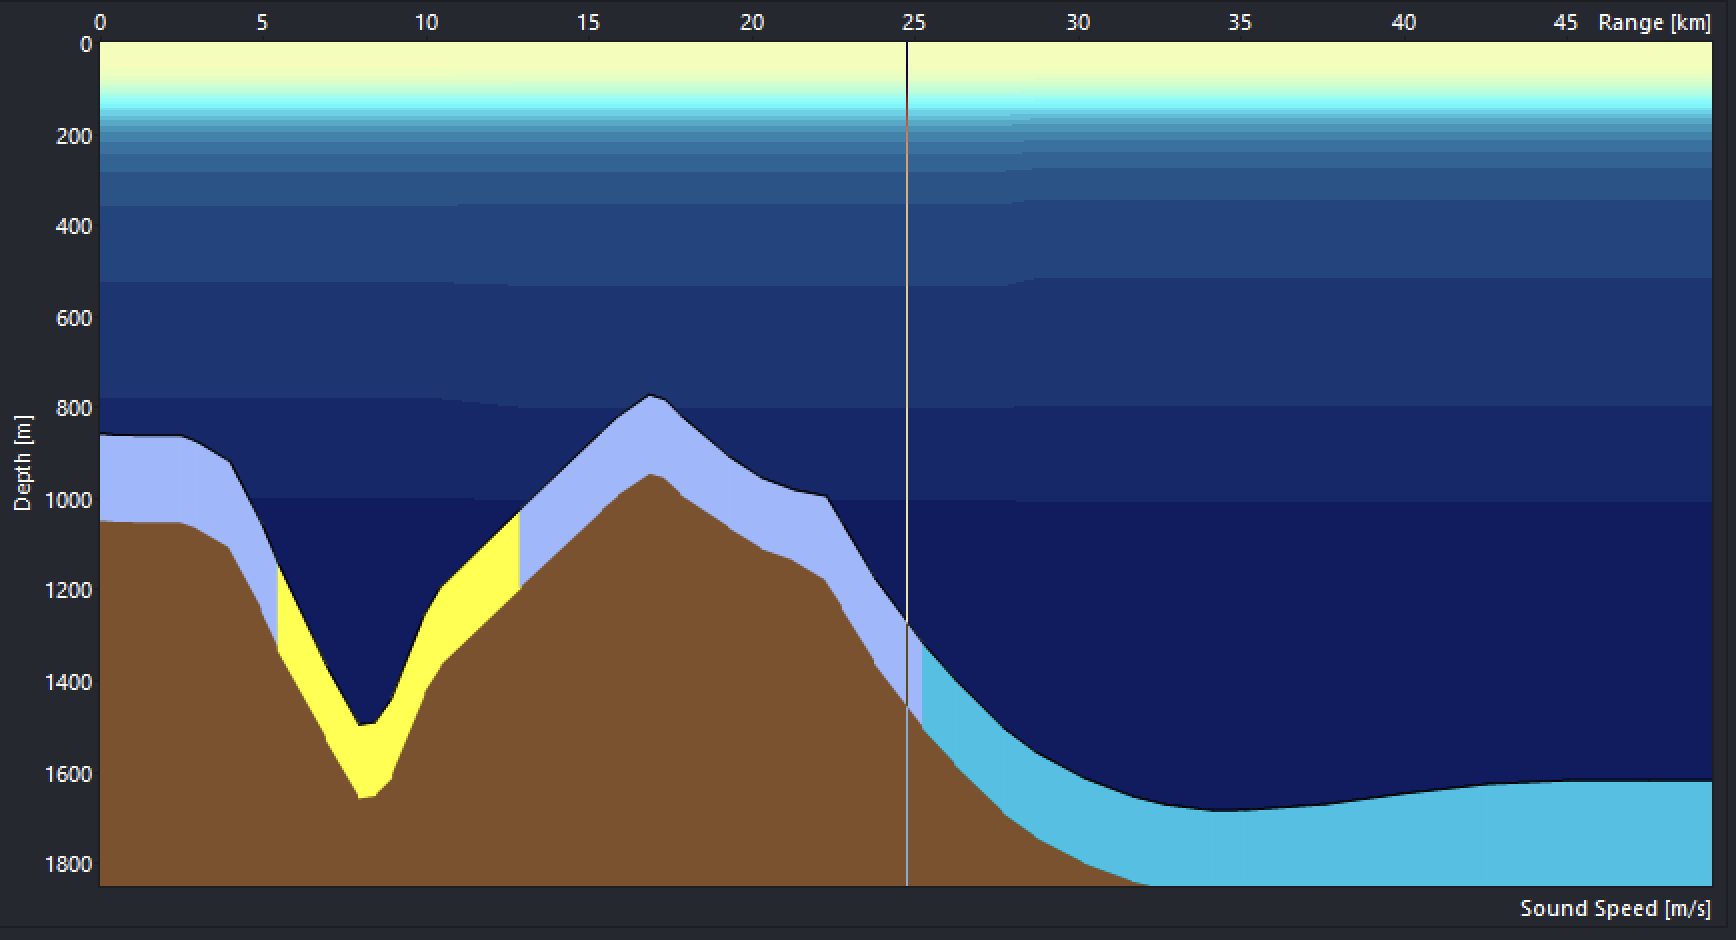
The Environment Editor allows users to edit both the track and operational environment. Users can upload and manage their own (measured) environmental profiles (salinity & SSP) from XBTs using time filters, edit the seabed properties and analyse the sound channel. The data is visualised using the seabed cross section and profile viewers. High resolution water column profiles can be merged either manually or automatically with the track for use in the analysis screen.

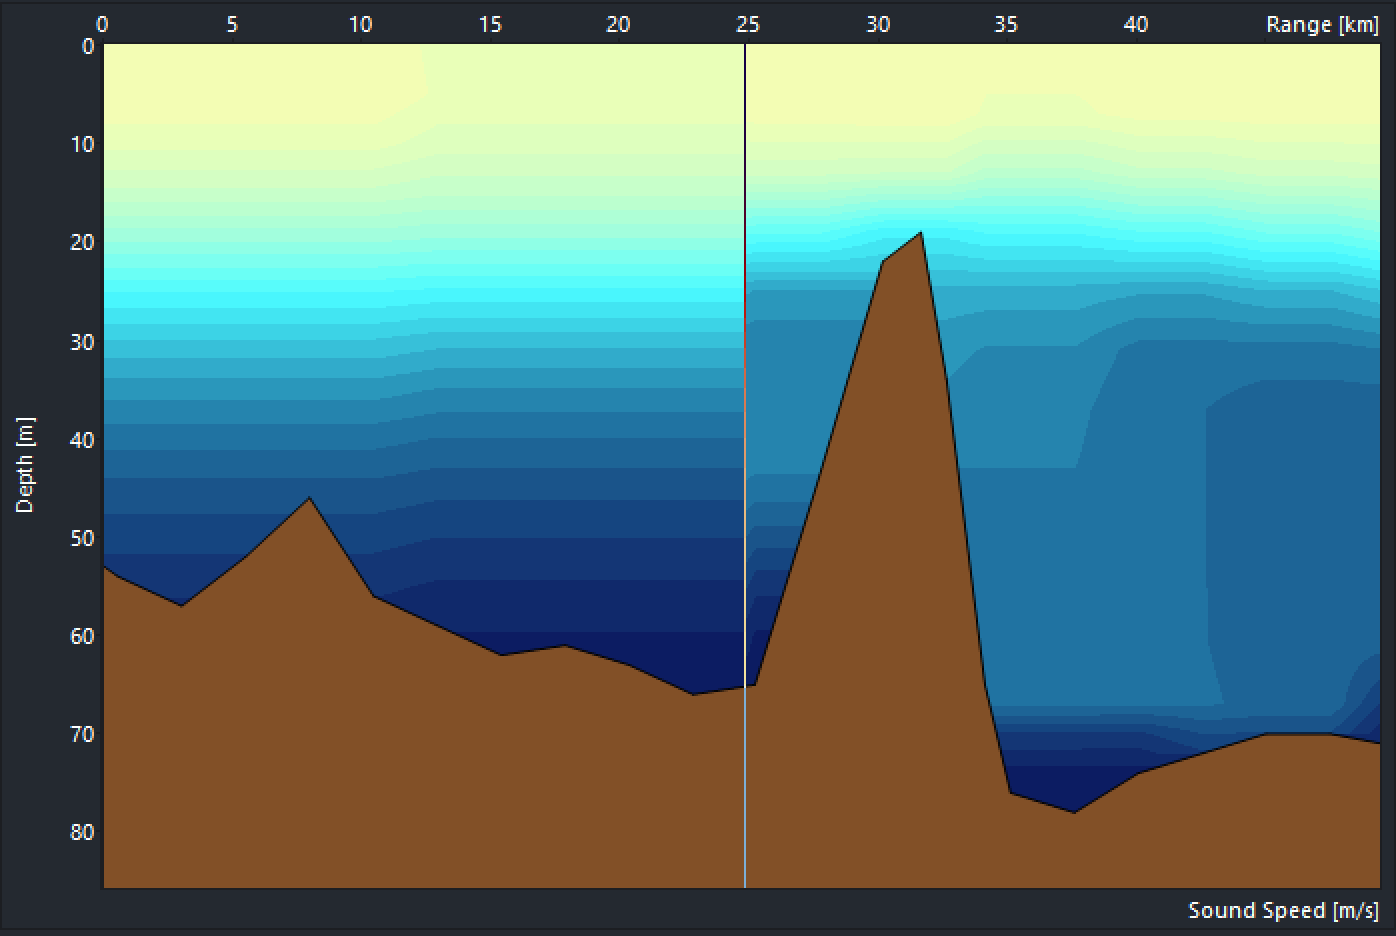
Cross Section Viewer on the Environment Screen
WADER is range dependent and the cross section viewer enables the user to view the temperature, salinity, sound speed, potential density and buoyancy frequency along their chosen track.
Each set of radials can be configured independently in terms of sonar type, frequency, depth and Figure of Merit (FOM).
Click on the images below to view other features on the Environment Screen.

DTSV Auto Merge
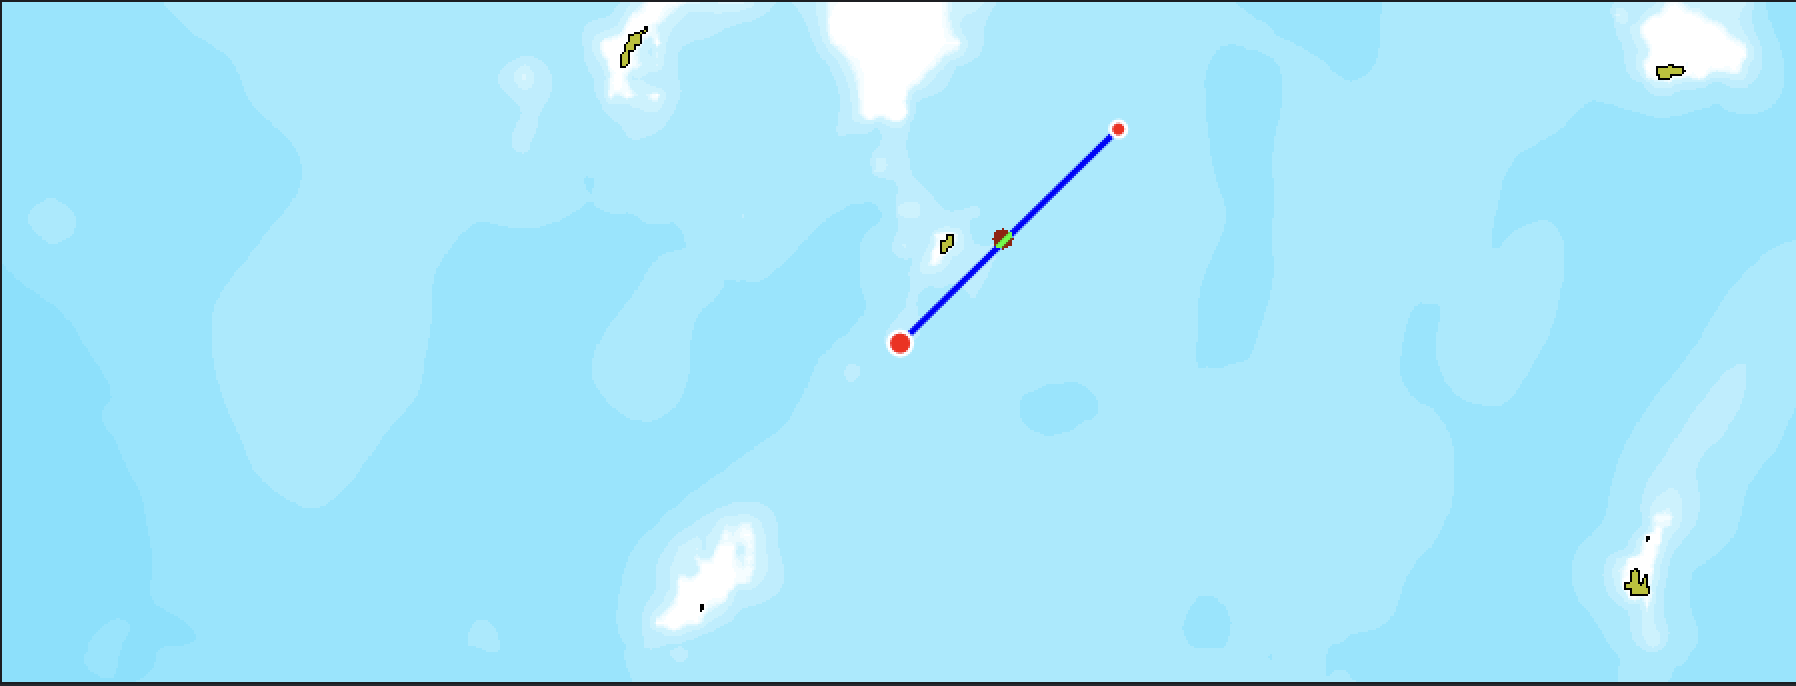
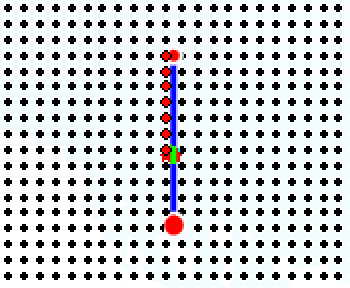
Users are able to upload their own profiles in DTSV format onto both the WADER Main Screen and Environment Screen. These could be your own climatological datasets or bathy data of the day. Once uploaded, the user is able to Auto Merge their own profiles with the climatology.
Each dot on the left hand chart represents a user's profile. In this case the profiles along the track have been auto merged from 25km to the end of the track.
Users can also upload their own profiles within the Environment Screen in CPD, JJYY or JJVV format. Other formats may be incorporated; please contact OAD to discuss your requirements.
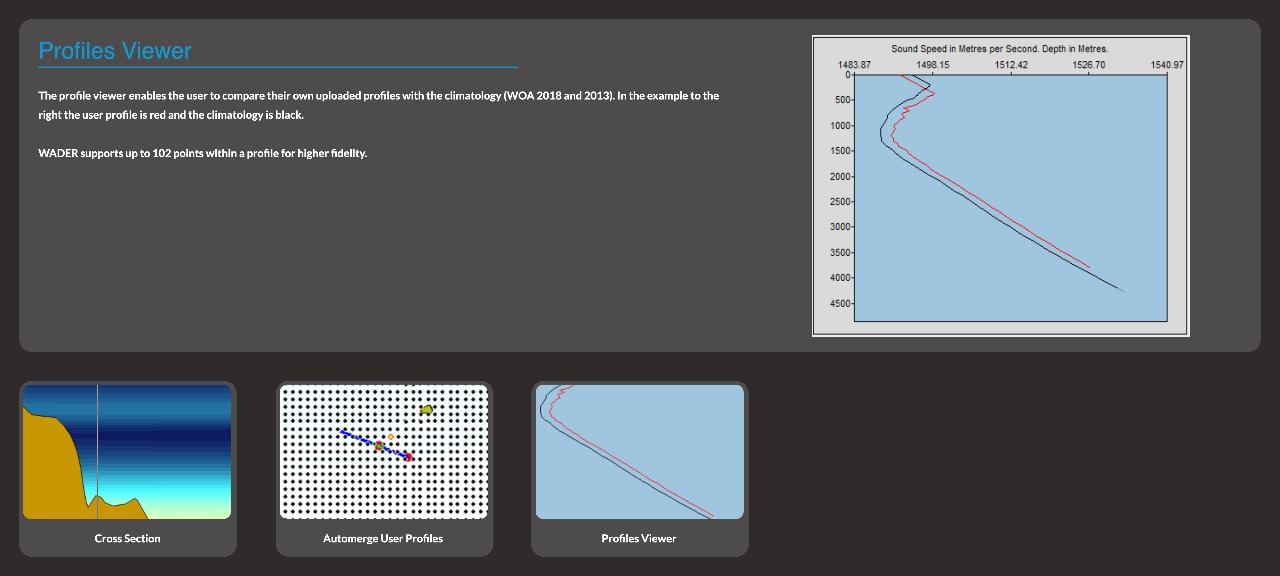
Profile Viewer
The profile viewer enables the user to compare their own uploaded profiles with the embedded climatology (WOA 2018). In the example to the right the user profile is red and the climatology is colour graduated.
WADER supports up to 102 points within a profile for higher fidelity.

Cross Section Viewer on the Environment Screen
WADER is range dependent and the cross section viewer enables the user to view the temperature, salinity, sound speed, potential density and buoyancy frequency along their chosen track.
Each set of radials can be configured independently in terms of sonar type, frequency, depth and Figure of Merit (FOM).
Click on the images below to view some other features on the Environment Screen.
DTSV Auto Merge
Users are able to upload their own profiles in DTSV format onto both the WADER Main Screen and Environment Screen. These could be your own climatological datasets or bathy data of the day. Once uploaded, the user is able to Auto Merge their own profiles with the climatology.
Each dot on the left hand chart represents a user's profile. In this case the profiles along the track have been auto merged from 25km to the end of the track.
Users can also upload their own profiles within the Environment Screen in CPD, JJYY or JJVV format. Other formats may be incorporated; please contact OAD to discuss your requirements.
Profile Viewer
The profile viewer enables the user to compare their own uploaded profiles with the embedded climatology. In the example to the right the user profile is red and the climatology is colour graduated.
WADER supports up to 102 points within a profile for higher fidelity.
Environment Editor

The Environment Editor allows users to edit both the track and operational environment. Users can upload and manage their own (measured) environmental profiles (salinity & SSP) from XBTs using time filters, edit the seabed properties and analyse the sound channel. The data is visualised using the seabed cross section and profile viewers. High resolution water column profiles can be merged either manually or automatically with the track for use in the analysis screen.
Cross Section Viewer on the Environment Screen
WADER is range dependent and the cross section viewer enables the user to view the temperature, salinity, sound speed, potential density and buoyancy frequency along their chosen track.
Each set of radials can be configured independently in terms of sonar type, frequency, depth and Figure of Merit (FOM).
Click on the images below to view other features on the Environment Screen.
DTSV Auto Merge
Users are able to upload their own profiles in DTSV format onto both the WADER Main Screen and Environment Screen. These could be your own climatological datasets or bathy data of the day. Once uploaded, the user is able to Auto Merge their own profiles with the climatology.
Each dot on the left hand chart represents a user's profile. In this case the profiles along the track have been auto merged from 25km to the end of the track.
Users can also upload their own profiles within the Environment Screen in CPD, JJYY or JJVV format. Other formats may be incorporated; please contact OAD to discuss your requirements.
Profile Viewer
The profile viewer enables the user to compare their own uploaded profiles with the embedded climatology (WOA 2018). In the example to the right the user profile is red and the climatology is colour graduated.
WADER supports up to 102 points within a profile for higher fidelity.
Cross Section Viewer on the Environment Screen
WADER is range dependent and the cross section viewer enables the user to view the temperature, salinity, sound speed, potential density and buoyancy frequency along their chosen track.
Each set of radials can be configured independently in terms of sonar type, frequency, depth and Figure of Merit (FOM).
Click on the images below to view some other features on the Environment Screen.
DTSV Auto Merge
Users are able to upload their own profiles in DTSV format onto both the WADER Main Screen and Environment Screen. These could be your own climatological datasets or bathy data of the day. Once uploaded, the user is able to Auto Merge their own profiles with the climatology.
Each dot on the left hand chart represents a user's profile. In this case the profiles along the track have been auto merged from 25km to the end of the track.
Users can also upload their own profiles within the Environment Screen in CPD, JJYY or JJVV format. Other formats may be incorporated; please contact OAD to discuss your requirements.
Profile Viewer
The profile viewer enables the user to compare their own uploaded profiles with the embedded climatology. In the example to the right the user profile is red and the climatology is colour graduated.
WADER supports up to 102 points within a profile for higher fidelity.
Environment Screen

The Environment Screen allows users to edit both the track and operational environment. Users upload and manage their own (measured) environmental profiles (salinity & SSP) from XBTs using time filters, edit the seabed properties and analyse the sound channel. The data is visualised using the seabed cross section and profile charts. High resolution water column profiles can be merged both manually or automatically with the track for use in the analysis screen.
Analysis Screen
The Analysis Screen is where the user conducts detailed propagation loss (proploss) analysis. The screen has a Probability Of Detection diagram (PODgram), proploss graphic, ray trace diagram and profile display. POD can be represented as signal excess, or, intensity distribution, with an option to overlay a comparative environmental impact assessment (EIA) chart if required. In-situ adjustments can be made for, amongst others, reverberation losses, target/source depths & sonar beam angle. Parameters for shipping, sea state and ambient noise are accounted for in the embedded figure of merit (FOM) calculators.

Sonar Editor
The Sonar Editor is where users build and save their own sonars for use in range predictions. Sonars can be grouped into Sonar Suites for use in different operations.
WADER is supplied with a comprehensive set of fictitious sonars (SPUTS) for training purposes.
Sonar Editor
The Sonar Editor is where users build and save their own sonars for use in range predictions. Sonars can be grouped into Sonar Suites for use in different operations.
WADER is supplied with a comprehensive set of fictitious sonars – SPUTS – for training purposes.
Sonar Editor

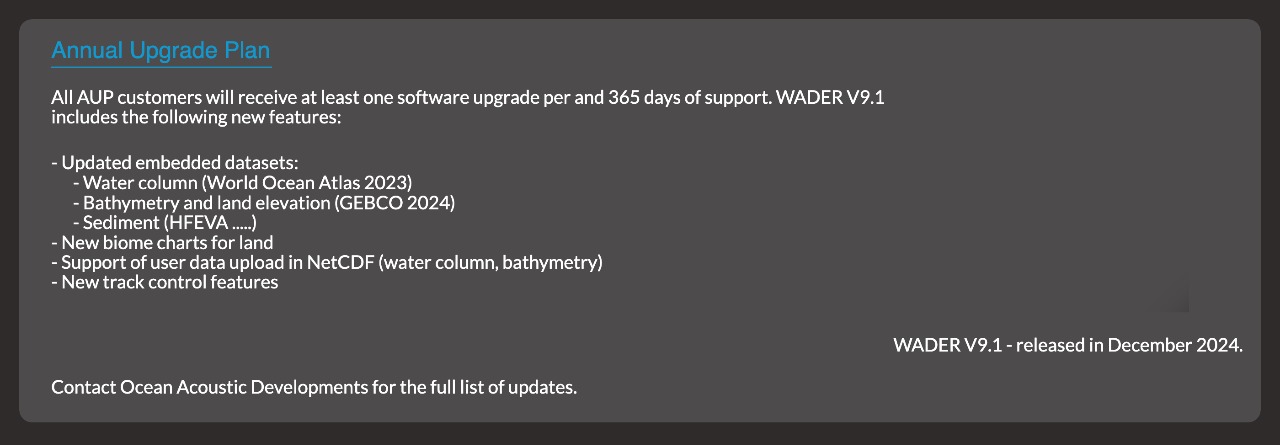
Annual Upgrade Plan
WADER can be purchased with an Annual Upgrade Plan which entitles users to email and telephone support, at least one software upgrade per year and datasets upgrades periodically.
Click here to see the Annual Upgrade Plan summary page.

Brochure
A WADER brochure is available in English. This document contains further information about WADER features, additional screenshots and data specifications.
Please email us to request a copy of the WADER V9.2 brochure.
Brochure
A WADER brochure is available in English. This document contains further information about WADER features, additional screenshots and data specifications.
Please email us to request a copy of the WADER V9.2 brochure.